Most investors understand the logic of the traditional 60/40 portfolio. Own a diversified mix of shares and bonds. Shares provide long-term growth. Bonds provide income and stability.
Over very long periods, that approach has worked. But there is a major qualification investors should not ignore: the price paid at the start matters.
The other thing that needs to be considered is that 10 years is a very consequential period of time to someone who has just retired or will do so in the near future. The old adage of “well it will work over 100 years” doesn’t make you feel any better if this coincides with your retirement.
GMO: 60/40 “Lost Decades”
GMO’s analysis of the U.S. 60/40 portfolio since 1900 is useful because it shows both sides of the story. Over the full period, the strategy produced a real return of approximately 4.7% per annum. That is a sound long-term result.
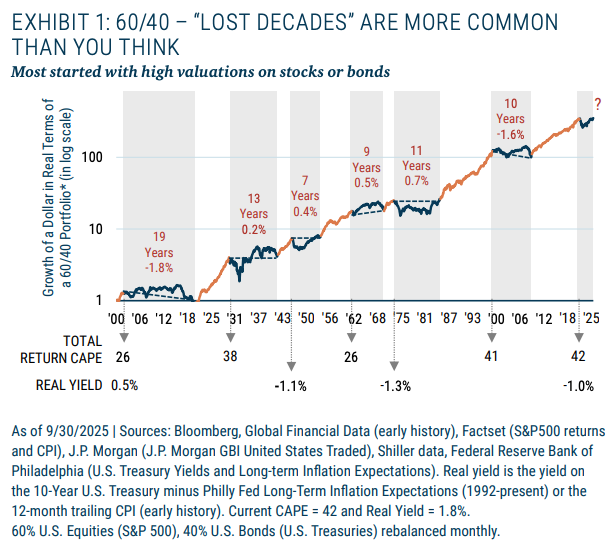
However, the same history also includes six weak periods averaging approximately 11 years, where investors either made no money after inflation or lost money in real terms.
That is the key point. A portfolio can work over 100 years and still be deeply frustrating for a decade or more. Again, if this is the first 10 years of your retirement, then you have a problem.
The Starting Point Matters
The shaded periods on GMO’s chart were not random. Most began when share valuations were high, bond valuations were high, or both.
In 1929 and 2000, the issue was mainly equity valuation. GMO’s chart shows a Total Return CAPE of 38 at the 1929 starting point and 41 around the 2000 technology bubble. Long-term bond yields later fell in both periods, which helped the bond side of the portfolio, but it was not enough to fully offset the damage from starting with very expensive shares.
The 1940s and 1970s were different. The problem was not just the share market. It was also the bond side of the portfolio. GMO shows negative real yields at key starting points, which meant bonds offered limited protection against inflation.
In the 1940s, long-term yields were held down while inflation eroded purchasing power. In the 1970s, inflation and long-term interest rates rose materially. That was a much harder environment for a balanced portfolio because both shares and bonds could struggle at the same time.
The early 1960s also show the problem of owning shares at elevated valuations as interest rates moved higher. Rising long-term rates can reduce the value investors are willing to pay for future company earnings, while also reducing the value of existing bonds.
Why this Matters Now
This does not mean investors should abandon diversification. It also does not mean a lost decade is guaranteed. The warning is more practical. Investors should be careful about relying on long-term average returns without considering the valuation starting point.
That is particularly relevant after a long period where equity valuations rose and interest rates generally fell. Falling rates helped both sides of the 60/40 portfolio for a long time. Shares benefited from higher valuation multiples. Bonds benefited from falling yields. If the next decade does not provide the same tailwind from falling interest rates, investors may need to be more selective about what they own and the price they are prepared to pay.
The Investor Lesson
A portfolio can be diversified on paper but still heavily exposed to the same underlying risk: expensive growth assets and expensive duration assets, both depending on low interest rates continuing.
A more robust approach looks beyond the headline asset allocation. It asks what real return is available from bonds, whether share valuations already assume a favourable future, and whether the portfolio has assets that can behave differently if inflation or interest rates surprise again.
Valuation discipline is not market timing. It is risk management.
Long-term averages are useful. But they are not a guarantee. The starting point still matters.
As discussed by Ray Dalio, “real diversification” matters in these periods of time, and that is what we are closely looking at for our client portfolios.
Sources:
- GMO / Ben Inker: A Second Opinion on the 60/40 Default: Just What the Doctor Ordered, GMO Asset Allocation Insights, October 2025.
- Federal Reserve Bank of St. Louis: Market Yield on U.S. Treasury Securities at 10-Year Constant Maturity [DGS10]. Used for the broad direction of long-term U.S. rates from the 1960s onward.
- Robert Shiller: Online Data. Used as a long-run reference for U.S. stock market valuation, inflation and long-term interest-rate history.
This information is general advice and does not take account of investors’ objectives, financial situation or needs. Before acting on this general advice, investors should therefore consider the appropriateness of the advice having regard to their objectives, financial situation or needs.
Written by Rob Coyte
CEO – Shartru Wealth